open to data & bi roles — netherlands

Francisco Rau_

I build the data function end to end — and sharpen the one that already runs. The pipeline, the metric, and the dashboard people check every morning.

Data & BI Analyst · MSc Data Science + BSc Economics, Tilburg University · EN / ES native · NL intermediate
Pillar one · contact-centre BI suite

One operation, four working tools

I owned operational BI end to end at a Dutch contact centre: capacity planning, performance measurement and live operational reporting. The operations P&L below is a concept of my own design, not part of that work. These are live, working recreations — same structure, metrics and logic, every name and number invented. Click into any of them.

01Plan the capacity 02Measure performance 03Live operations view 04Price it in euros
01 · Plan

Campaign Staffing Simulator

Any mailing calendar in, daily agent demand out — 500+ days ahead. A cohort funnel with measured pickup decay and callbacks that re-enter on their promised day, plus flow-choke detection and a batch optimizer that re-verifies its own fixes by re-simulating.

under-staff → letters wait · over-staff → everyone slows down. The target is the right number.
Pythoncohort modelingforecastingoptimization
Open the live simulator
02 · Measure

Daily Agent Report

Every agent judged against a “frontier” — the 70th percentile of their own campaign's clean-day performance, so a hard workload or short shift is never unfairly penalised. A pace × closing index, statistical shrinkage for thin samples, and a dialer burn-down that predicts what carries to tomorrow.

combined = pace × closing — volume can't hide weak conversion, or vice-versa.
metric designstatisticsbenchmarkingExcel/Sheets
Open the live report
03 · Runruns live

Agent TV Board

A supervisor wallboard for a live operations view. Live queues, agent statuses with idle-time flags and passed-call counters, incoming-call routing, and a rotating stats panel — calls, conversion and pace, per agent and per campaign. This page simulates a live operations view in real time.

dark · full-screen · best on a desktop
real-timedashboardsops designJavaScript
Open the live board
04 · Priceconcept · own design

Operations P&L — Unit Economics

The layer that turns it all into money: what every agent-hour costs, what every campaign, call attempt and talk-minute earns. Attempt-level economics expose where the retry schedule starts losing money; break-even durations and closing rates turn operational metrics into executive decisions.

“attempts 4–5 lose €239/day” — the retry policy is a money dial, not an ops dial.
unit economicsP&L modelingbreak-even analysis
Open the P&L model
Pillar two · Citania

From a market gap to a live product

Built on my own time — first the data pipeline that proved the gap was real, then the product that fills it. A live SaaS in the Fresha category, for a region no one serves yet.

Data pipeline · real measured result

Mapping a market gap across Mexico City

The research question behind the venture below: how many beauty & wellness businesses in CDMX still have no way to book online? I built an end-to-end pipeline to measure it across the whole city — 722 structured Google Places queries, deduplicated to 10,605 unique businesses, booking adoption then classified two independent ways.

  • Dual detection — booking-platform domain matching plus a headless-browser check of Google's own "Reserve" button, which caught bookers the domain check missed.
  • Dead-API workaround — the INEGI DENUE registry API was down nationwide, so enrichment pivoted to its 43 MB bulk CSV, matched locally by industry code + name + location.
  • Resumable by design — every stage checkpoints; a 15-hour overnight run survives interruption and never re-bills an API call. ~$70 total spend.
PythonGoogle Places APIPlaywrightdeduplicationpublic-registry data
Places API queries 722
Unique businesses 10,605
Already bookable online 727
Qualified leads · no booking 9,878
…with a direct phone 8,821
93%
no online booking
89%
have a phone
8
business categories
~$70
total API spend
SaaS product · live

Citania — booking & payments for LATAM beauty

The product the research pointed to: a multi-tenant booking-and-payments platform in the Fresha category, built for Latin America (Spanish, MXN, CDMX-first) — a genuine pain point with no serious player in the region yet. A TypeScript monorepo — Express 5 + Postgres, contract-first OpenAPI, a React web app and an Expo React Native mobile app.

  • 100+ integration tests over the full booking flow, with database-level slot exclusivity — double-booking is impossible by construction, not by hope.
  • Two-way Google Calendar sync live, with loop prevention via source tags, booking IDs and etags.
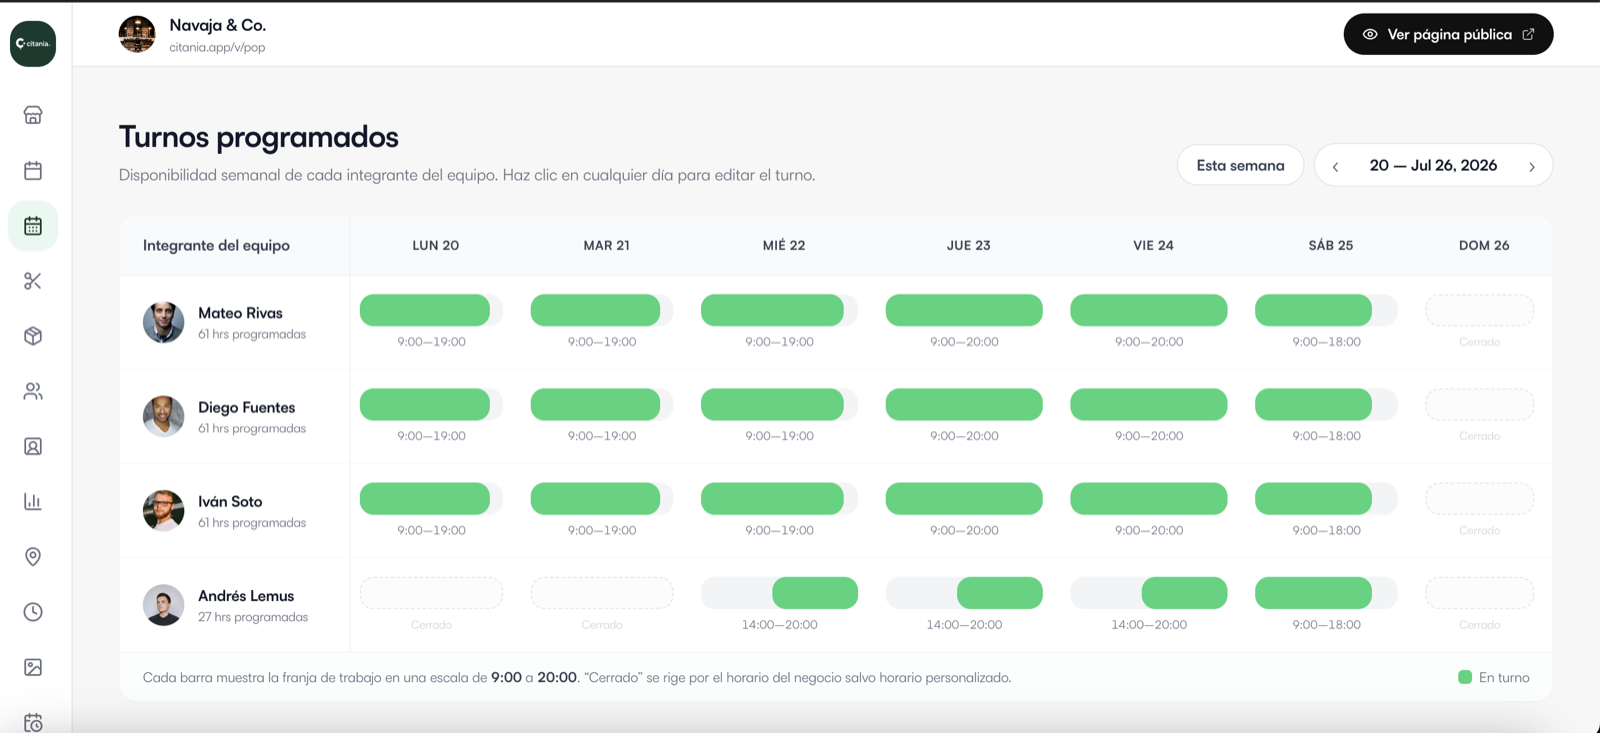
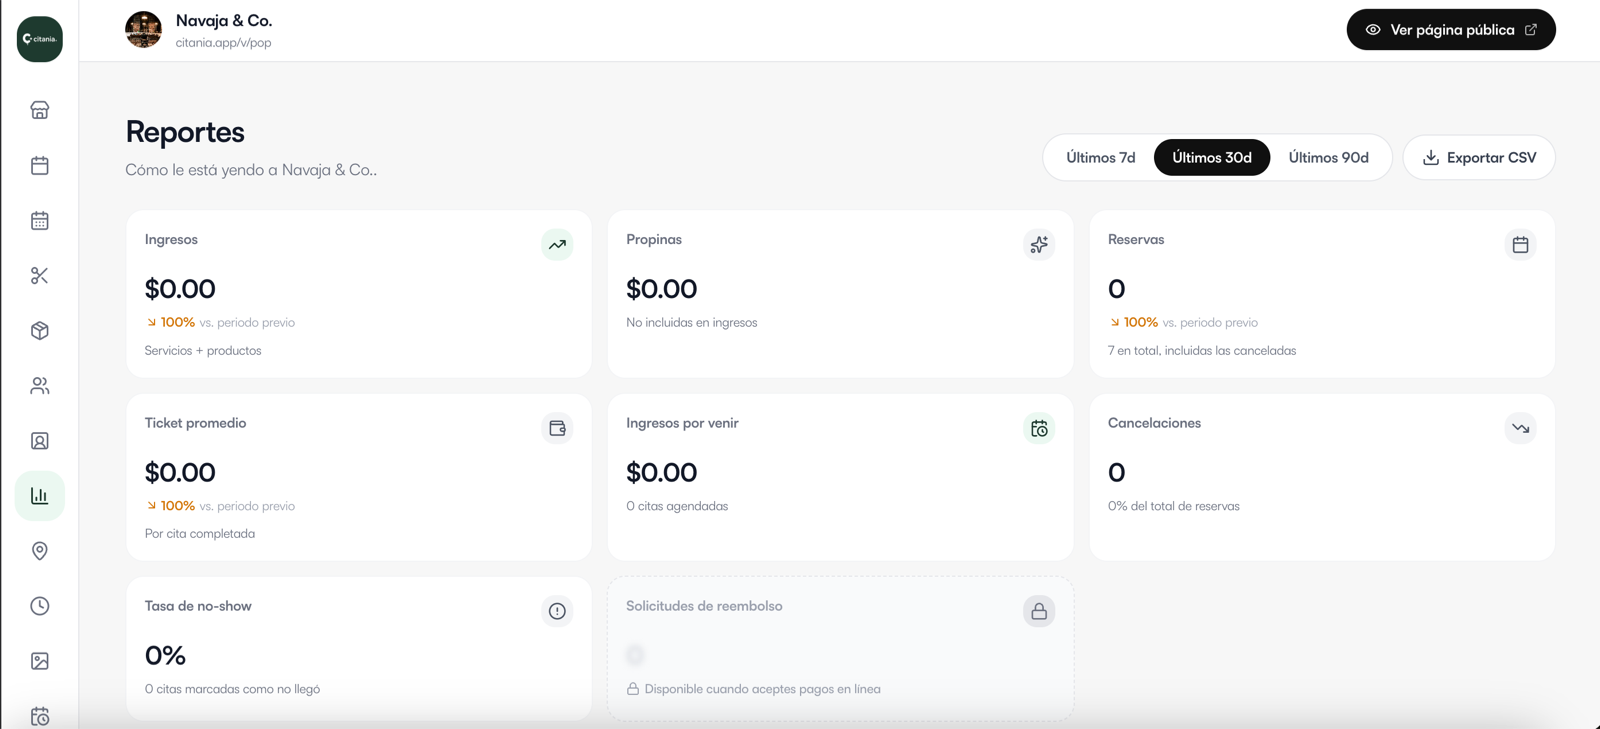
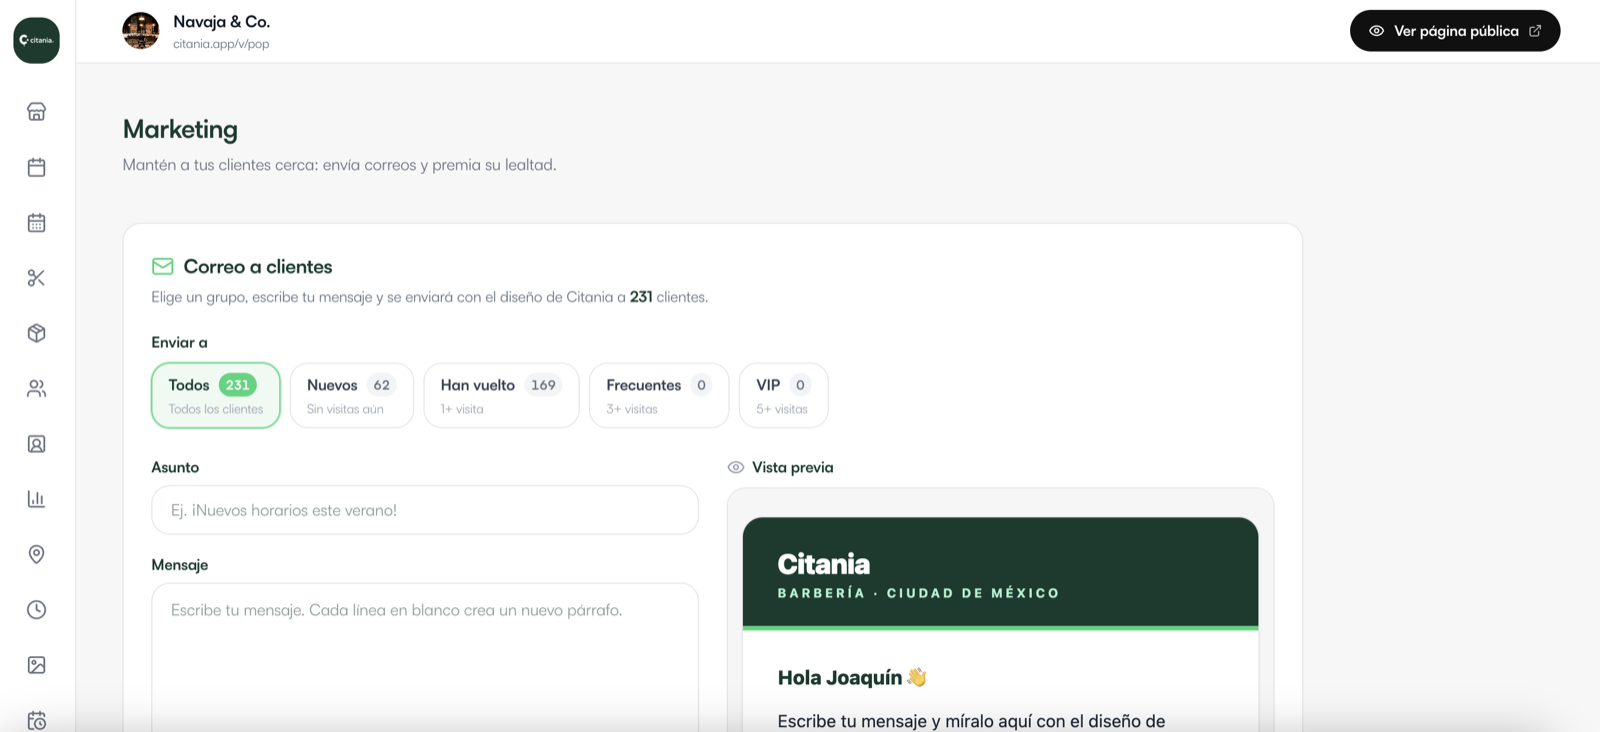
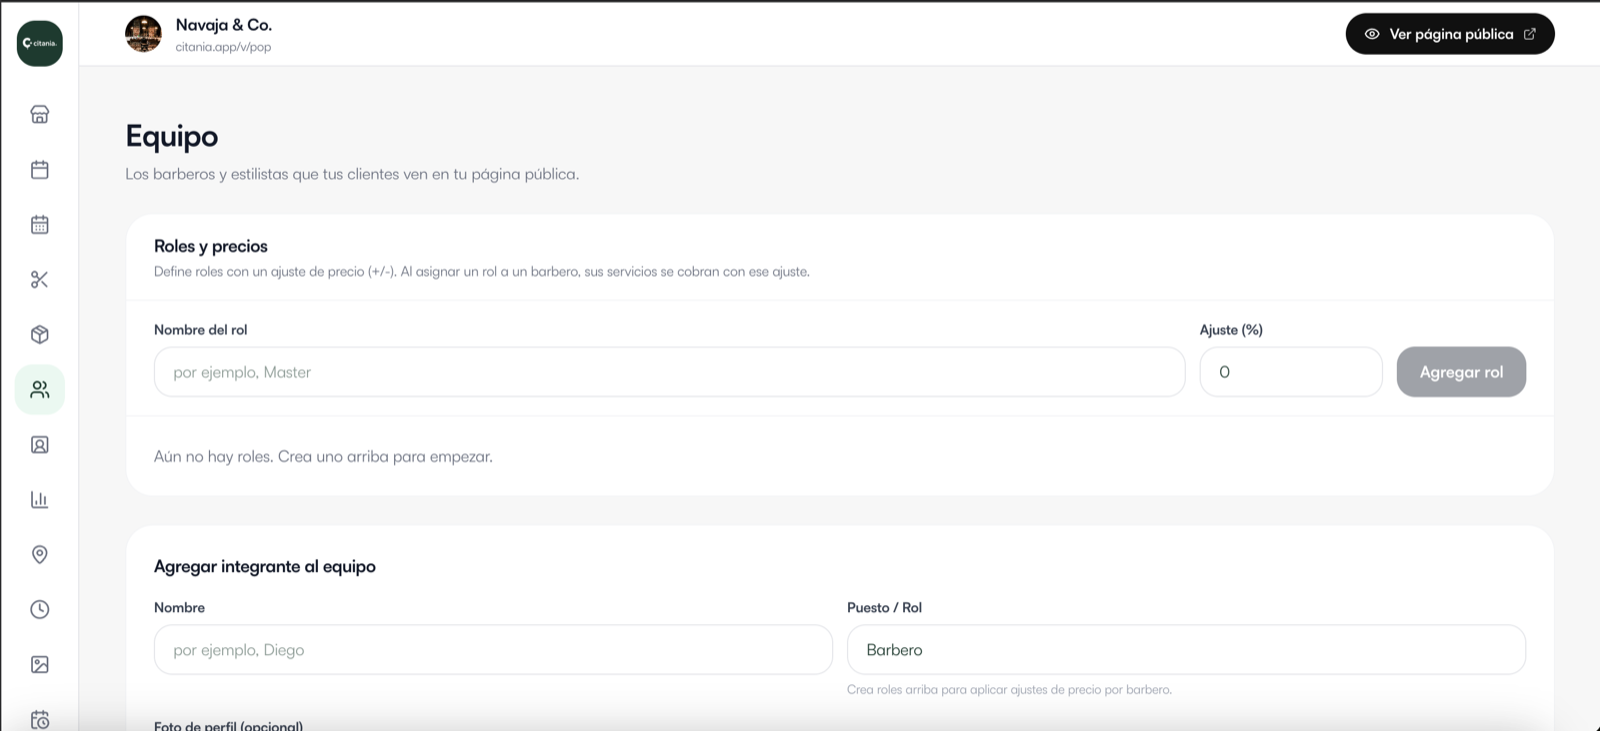
  • Role-based pricing, cancellations, reviews, reminders, segmented marketing + loyalty, and a full owner dashboard (calendar, services, team, inventory, clients, reports).
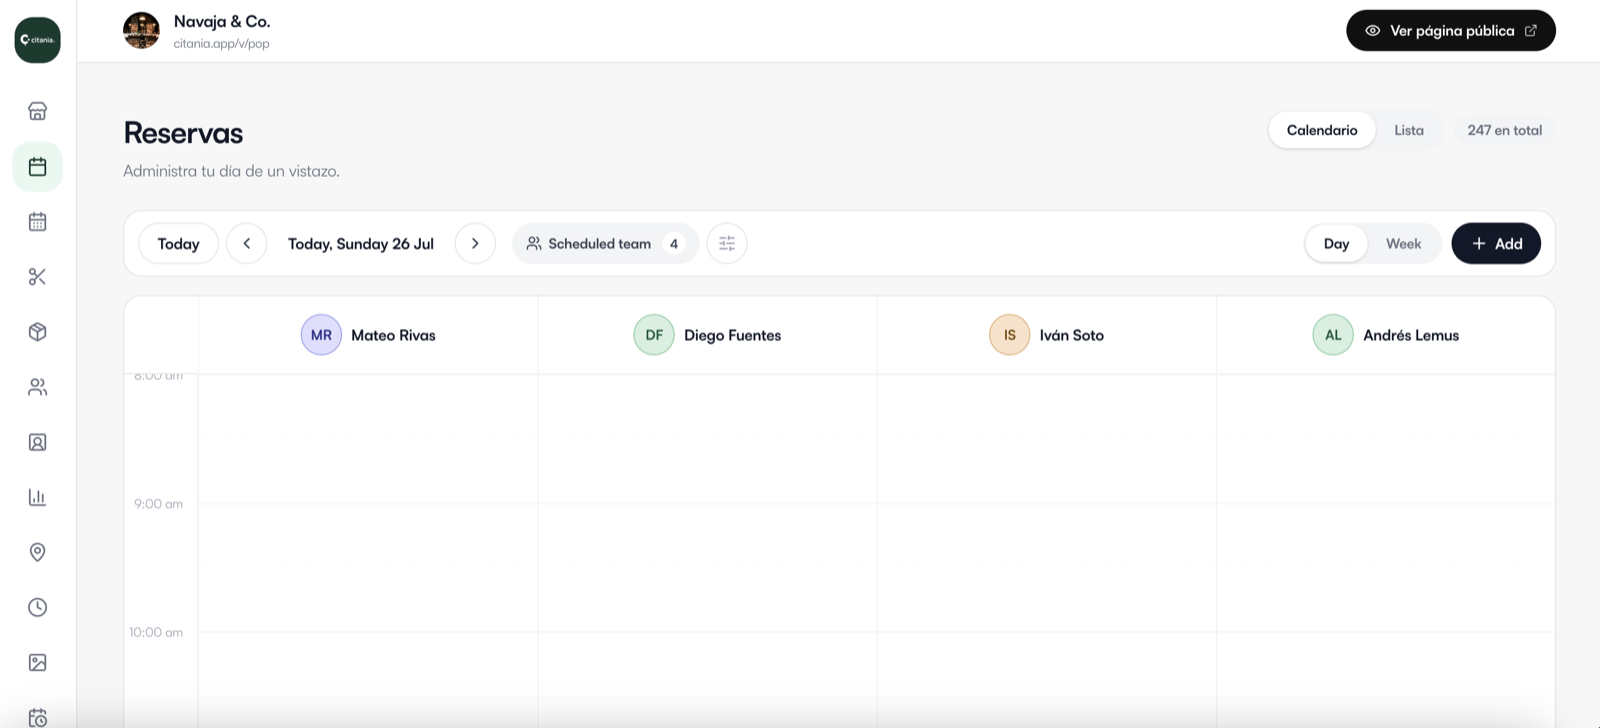
Owner dashboard — the operator side of the product
Consumer marketplace — real product, real-time availability, booking flow end to end. Open the live marketplace →
TypeScriptPostgreSQLExpressOpenAPIReactReact NativeStripe
Pillar three · quant research

Do prediction markets price the weather efficiently?

A full research system built to find out — and the discipline to publish the honest answer, not a flattering one.

Quantitative research · honest null result

Weatherbot — mispricing detection on weather markets

Weather markets settle on official observations published on a fixed schedule, so in principle mispricings should be detectable. I built the system end-to-end to test it: forecast ingestion, implied-probability extraction from order books, no-arbitrage / coherence checks across every temperature strike ladder, and latency measurement between an observation publishing and the market repricing — backtested across ~3,000 markets.

The finding is negative — and that is the point. The original thesis went 0 for 24 against resolution, and the book spread on those contracts runs 30 to 100 percent of mid, so nothing was tradable even where an edge looked real. Exchange fees are zero on that venue; spread is the cost. I documented it as a rigorous null result instead of curve-fitting a backtest that "works." Knowing when a signal isn't tradable is the skill — it's the same discipline that decides whether a metric is trustworthy enough to put on a dashboard.

weatherbot · scan cyclereplay · analysis only · no live trading
0
markets scanned
0
candidate edges flagged
~3,000
markets backtested
0
tradable after costs
market microstructureprobability calibrationno-arbitrage testsbacktestingAPI ingestionhonest null result
Pillar four · Alpha Scout

A football scouting & valuation platform

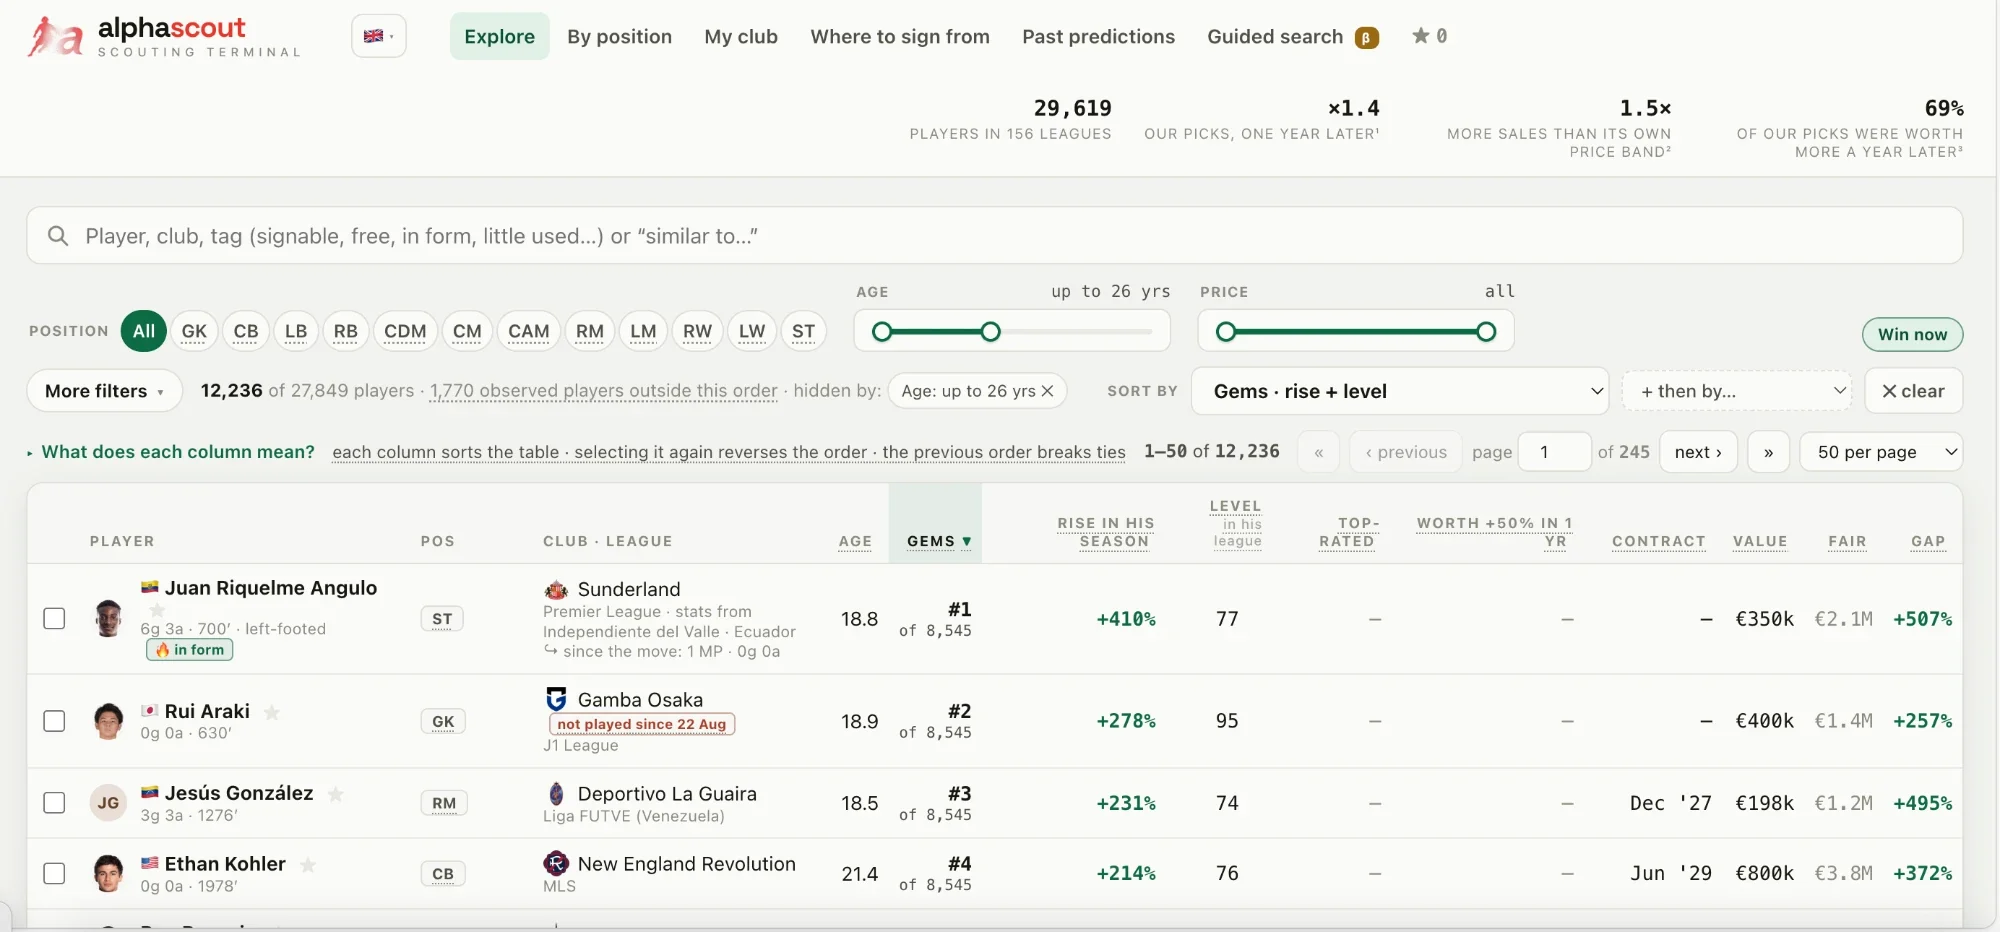
Solo-built, end to end: the harvesting pipeline, the statistical models, the product and the design. 23,353 players across 155 leagues, valued match by match — with the honesty published.

Live product · beta

Alpha Scout — find undervalued players before the market does

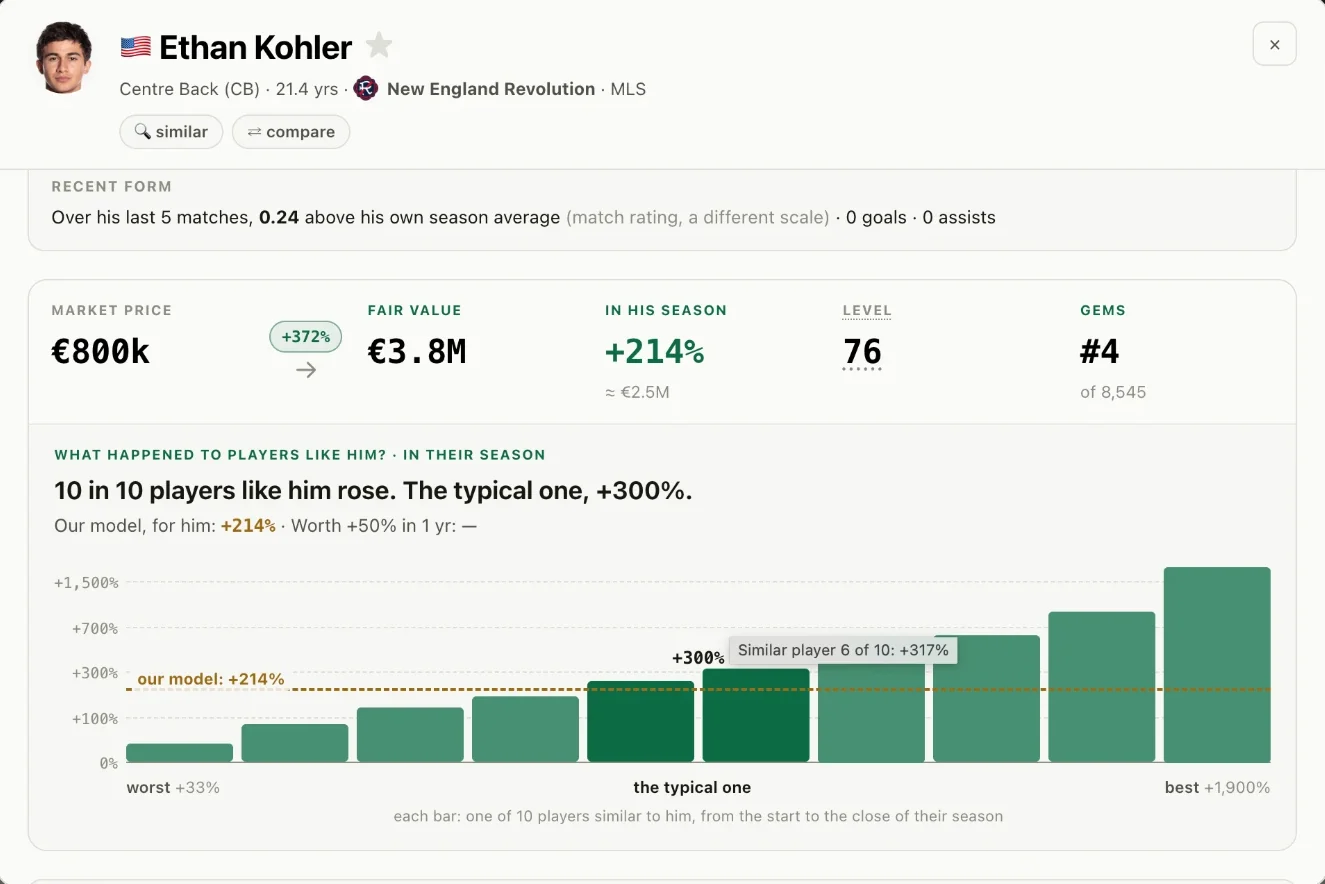
A hedonic fair-value model (R² = 0.74 on live data) prices every player from performance, age, league difficulty and contract; calibrated probabilities say how often profiles like his actually rise. Forward-tested, not curve-fit: players the model flagged as undervalued were signed 1.7× more often than their peers in the following transfer window.

  • The data is the moat — automated match-by-match harvesting across 155 leagues, self-healing browser pipeline, weekly refresh, ~98,000 player-seasons of history with observed 12-month outcomes.
  • Honesty as a feature — the backtest is published per league including where the model is weak, and it declines to price players above €60M: outside its validated range, it says so instead of guessing.
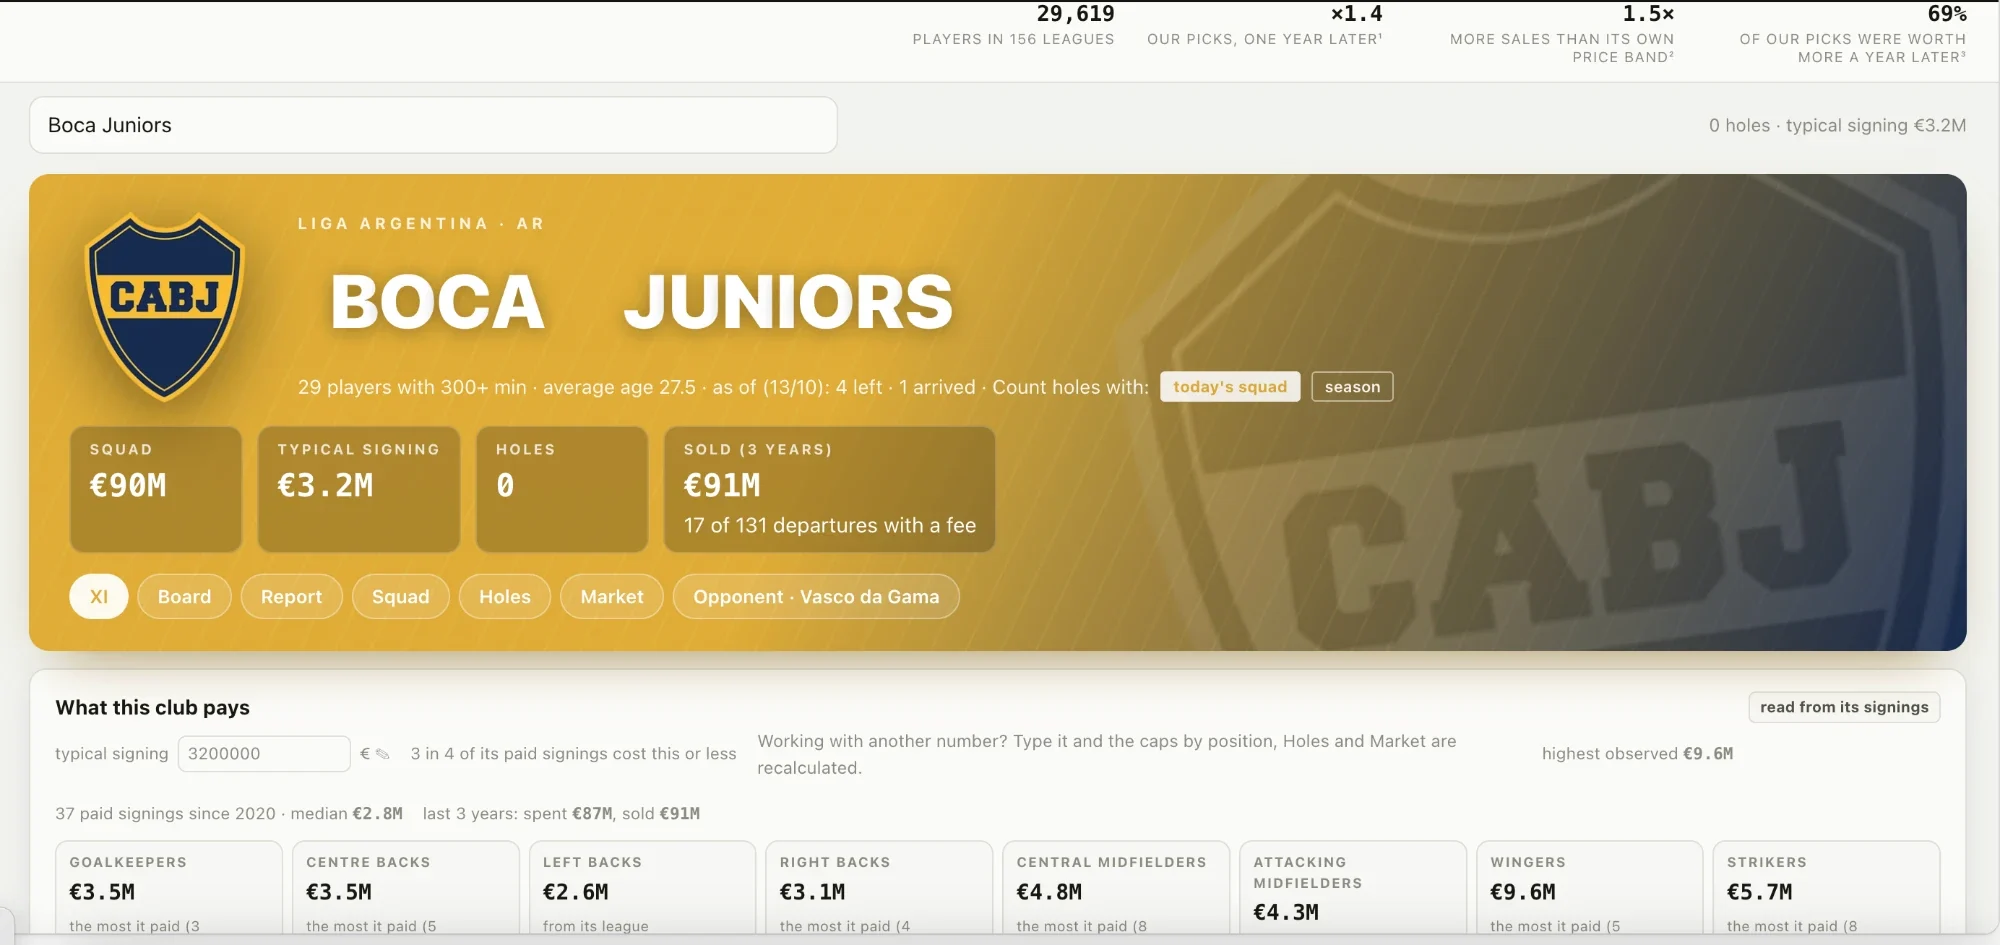
  • Built for the buyer — club view with squad gaps and realistic budgets, "similar players under €1M from your region", contract-expiry radar, one-click club reports.
The live demo — 20 of the 23,353 players, real data
Pythonstatsmodelscalibrated probabilitiesforward testingPlaywrightCloudflare
Try the live demo → ⚽ Football data hub →
Earlier work

Modeling & research

Econometrics · research

Erroneous convictions (ENPOL)

Empirical paper on Mexico's national prison-population survey — quantifying due-process failures linked to wrongful-conviction risk.

econometricssurvey data
More

Repos and write-ups on GitHub.

github.com/FranciscoRau08